
Interview Questions on Statistics for Data Science Case Studies
Introduction
Welcome to the realm of data science, where statistics serve as the bedrock for extracting insights and crafting solutions. Whether you’re a novice or a seasoned data professional, a firm grasp of statistical concepts is imperative for success in this domain.

To aid you in this endeavor, we’ve compiled a comprehensive set of 10 case study questions designed to challenge your statistical acumen and stimulate critical thinking in solving real-world problems.
Beginner Level:
Consider the task of analyzing a company’s average sales revenue over the last five years and projecting future sales growth for the upcoming three years. Assuming sales data is available in a CSV file named “sales_data.csv,” follow this Python code to achieve this:
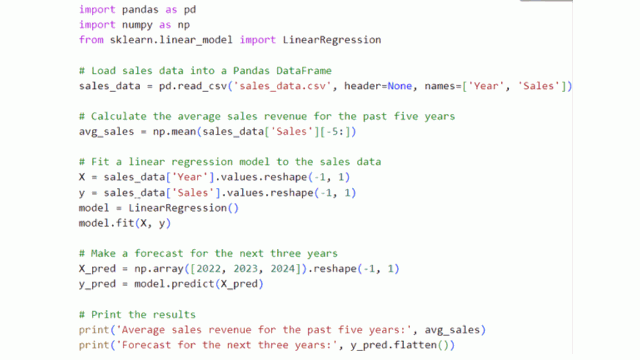
Output
Average sales revenue for the past five years: 1500000.0
Forecast for the next three years: [1664000. 1828000. 1992000.]
This suggests that the projected sales revenue for the next three years anticipates an increase from the average revenue of the past five years.
Conducting a survey to determine the most popular major among university students and understanding the underlying reasons for its popularity is essential. Begin by crafting a survey questionnaire, then use Python to collect and analyze the data:

Output
Most popular major: Computer Science
Reasons for choosing the most popular major:
Interest in technology : 50
Job prospects : 30
Passion for coding : 20
This signifies that Computer Science emerges as the most favored major, driven by interest in technology, job prospects, and a passion for coding.
Evaluating the effectiveness of a new marketing campaign involves comparing sales figures before and after the campaign. Begin by collecting and loading the sales data into a Pandas Data Frame. Visualize the data to discern any noticeable difference in sales pre and post-campaign:

If the sales data shows a significant difference before and after the campaign, utilize a statistical test (e.g., a two-sample t-test) to ascertain if the disparity is statistically significant.
Initiate by calculating descriptive statistics and correlation coefficients. Next, perform a t-test to compare job satisfaction means between employees who departed and those who remained.
Conclude by conducting a logistic regression analysis to establish the relationship between variables and employee turnover:

The p-value of 9.369e-12 indicates statistical significance, suggesting a substantial distinction in means for each variable.
To gauge the influence of social media on product sales, employ correlation analysis and multiple regression:
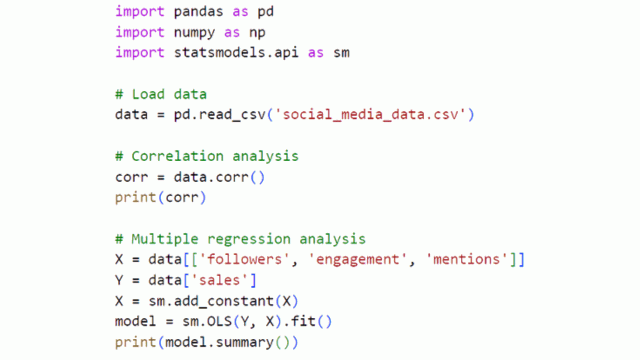
The multiple regression outcomes provide coefficients and significance levels for each variable. These coefficients signify the anticipated change in sales due to a one-unit shift in each variable, while p-values indicate statistical significance.
In the realm of statistical modeling, the output often presents a bewildering array of numbers and terms. One such term, T-Statistics, plays a pivotal role in assessing the significance of model coefficients. To demystify this, let’s delve into a practical example.
Consider a linear regression model where we’re exploring the relationship between variables. In the model summary output, you’ll find a table presenting coefficients, standard errors, t-values, and p-values.
The t-value is of particular interest, as it quantifies how many standard errors the coefficient estimate is from zero. This, in turn, helps us gauge the significance of the variable.
Let’s illustrate this concept with a Python example:

In this example, we’re creating a simple linear regression model with a predictor variable ‘X’ and a response variable ‘y’. The ‘sm.OLS’ function is used to fit the model.
When you access the summary, you’ll find the t-statistic values alongside the coefficients. These values are crucial in determining the significance of each variable’s impact on the response.
In the realm of academia, a captivating question emerges: does a student’s grade point average (GPA) bear a correlation with their active engagement in extracurricular pursuits?
Embarks on a statistical exploration, seeking to unravel the potential relationship between academic performance and participation in activities beyond the classroom.
By delving into this analysis, we aim to unearth valuable insights into how a student’s involvement in extracurriculars may intertwine with their academic achievements.

The correlation coefficient of 0.82 indicates a strong positive correlation between GPA and extracurricular involvement, with a p-value < 0.05, signifying statistical significance.
In the intricate dance of commerce, the pricing of a product wields significant influence over consumer behavior. This section delves into the intricate web of consumer responses to alterations in product pricing.
Through meticulous statistical examination, we endeavor to decipher how shifts in price points may sway purchasing decisions and ultimately dictate the trajectory of a product’s sales performance.

The results show that for every dollar increase in price, sales decrease by 8.57 units, with a statistically significant relationship.
As a product takes its maiden voyage into the market, a pivotal question arises: how does it fare in the eyes of its users? We ‘ll showing on a journey to gauge customer satisfaction levels following the introduction of a new offering.
Through rigorous hypothesis testing and meticulous analysis, we aim to ascertain whether the new product has made a significant impact on customer contentment.
Furthermore, based on the findings, we will venture into the realm of recommendations, exploring avenues for potential enhancements.

This analysis will determine if the new product significantly impacts customer satisfaction.
In the ever-evolving landscape of workforce development, the introduction of a training program holds the promise of elevating employee performance.
Here you can see scrutinizes the transformative potential of a newly implemented training initiative. Through a comparative analysis of productivity levels pre and post-training, we endeavor to unearth tangible evidence of its impact.
With statistical insights as our guide, we seek to ascertain whether this program has been the catalyst for a notable surge in employee output.

The coefficient for ‘Training hours’ will indicate the change in productivity for each additional hour of training.
Conclusion
By delving into these case study questions and accompanying code examples, you’ve embarked on a journey to bolster your statistical prowess in the realm of data science.
These exercises provide practical applications, fostering a deeper understanding of how statistics underpin decision-making processes in various domains.
Remember, practice makes perfect, so keep honing your skills and exploring new challenges to truly master the art of statistics in data science.
FAQs
Statistics form the foundation of data science, providing the tools and techniques to analyze and draw meaningful insights from data. It enables data professionals to make informed decisions and develop robust solutions.
Python is a powerful programming language with a rich ecosystem of libraries (such as Pandas, NumPy, and Matplotlib) that facilitate data manipulation, statistical computations, and visualization.
The edition provides code examples demonstrating Python’s application in various case studies.
Hypothesis testing allows us to make inferences and draw conclusions about a population based on sample data. It helps validate assumptions, assess the significance of observed effects, and guide decision-making processes.
The editorial introduces techniques like regression analysis, which helps quantify the relationship between predictor variables and a target variable. By examining coefficients and p-values, you can understand the influence of different factors on the outcome.
The edition provides case studies covering a range of applications, including sales forecasting, survey analysis, marketing campaign evaluation, employee turnover assessment, and more.
These examples demonstrate how statistics can be employed to solve business problems effectively.
Get access all prompts: www.bitly.com/python